In my past two blog posts, I’ve explored how to combine multiple port scanning tools to create a fast service scanning tool for large networks, and how I sped up nmap’s service scanning by changing its “wait for content” time. In this post, I’m going to be exploring how you can enrich the nmap-services-probes file with new information which offers both better results but also further speeds up service scanning.
As discussed in the previous post, the nmap-service-probes file contains a series of probes and subsequent matching rules. To put it simply, in order to discover which service is running on a port, nmap will send a probe, wait a pre-defined period of time of around 6-7 seconds (unless the connection is closed, as many services will do upon an invalid or null/empty probe), and then attempt to match the response with a string. If no match is found, the next probe is sent. This repeats until either a match is found, or until the end of the list of probes. The process looks a bit like this:
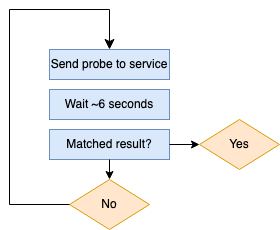
As we can see, if a service is not identified, every probe is sent one after another – not in parallel. This means that any service that nmap doesn’t know about is going to slow down our scanning considerably.
In the context of my tool, I was scanning an extremely large internal network which hosted thousands of instances of a software which nmap did not know about. This was an extreme slowdown, since it would send all the probes to all the instances, effectively blocking the service scanning process.
If you have thousands of servers running services that are unidentifiable by nmap, the solution is simple: make them identifiable!
During a preliminary pass-through of the hosts I was scanning which took a considerable amount of time, I noticed that some-thousands of servers were hosting an unidentifiable software on port 80. Since they were unidentifiable, nmap’s service scanning went through all of the probes, wasting time because it was never going to succeed – on thousands of servers.
In order to not waste time on not identifying them, I decided to create my own rules for matching them, so they would both be matched and not waste time being sent more than the first probe. So that’s what I did.
For most of the unidentified services, the empty probe (the first one) illicited a reply which could be used to match the service. An example of a match is:
match http m|^HTTP/1\.[01] \d\d\d .*\r\nServer: Apache\r\n|s p/Apache httpd/ cpe:/a:apache:http_server/
which is in the format:
match <service> <pattern> [<versioninfo>]
The format is also quite simple:
- service: The service name such as “http”, “ssh”, “mysql”, and so on.
- pattern: a perl-form regex pattern to match the response received from the probe.
- [<versioninfo>]: Various optional flags for extracting/displaying extra information about the match (read more here)
[<versioninfo>] may contain various information, however we’re going to be creating them with only p/vendorproductname/, v/version/, and i/info/ values. Other values are o/operatingsystem/, d/devicetype/, and cpe:/cpename/[a].
Pattern matching generally uses perl’s matching and substitution operators. Some of the well-known services that I discovered which would not match on anything are: Blackbox Exporter, Node Exporter, Hadoop IPC, Clickhouse, MariaDB, Grafana, Apache Cassandra, and Kubernetes Dashboard.
Some of these already have matching rules in the default nmap-service-probes, however they apparently do not match with all versions of the software they should, so we need to create new ones (or improve the other ones).
Here are just some of my additions:
match hadoop-ipc m|request\x20to\x20a\x20Hadoop\x20IPC|s p/Hadoop IPC/ cpe:/a:apache:hadoop/
match mysql m|HY000Proxy\x20header\x20is\x20not\x20accep|s p/MariaDB/ i/unauthorized/ cpe:/a:mariadb:mariadb/
match prometheus m|<head><title>Node\x20Exporter</title></head>|s p/Node Exporter/
match prometheus m|<head><title>Blackbox\x20Exporter</title></head>|s p/Blackbox Exporter/
match cassandra-native m|^\x84\0\0\0\0\0\0\x002\0\0\0\n\0,Invalid\x20or\x20unsupported\x20protocol\x20version:| p/Apache Cassandra/ i/native protocol version 4/ cpe:/a:apache:cassandra/
match http m|^HTTP/1\.[01] \d\d\d .*Server: Pike v([\d.]+) release (\d+): HTTP Server module\r\n|s p/Pike http server/ v/$1/ i/Release $2/
As shown in the final addition you can see it is also possible to capture text and then list it in the version info.
If these services are running at scale on the network you’re scanning, then the additions of these to the nmap-service-probes file is will make a huge difference in scanning time.
In some cases, you may even need to make a probe yourself. This isn’t difficult: you just have to literally list what you want to send to the server, and then create a matching rule for it yourself.
In general, that one weird trick! is: look at the unidentifiable services you find in your network, and create probe/matches for them: you’ll learn more about your network, and your scanning will be much faster.
One final unrelated note about the nmap-service-probes file. I don’t want the service scanning to skip any ports, so I removed this part (which is by default):
# The Exclude directive takes a comma separated list of ports.
# The format is exactly the same as the -p switch.
Exclude T:9100-9107